Knitr Layout
TipLearn more
See the full guide on Figures and Article Layout.
Use knitr fig-ncol
::: {#fig-panel .cell layout-ncol="3"}
```{.r .cell-code}
plot(cars)
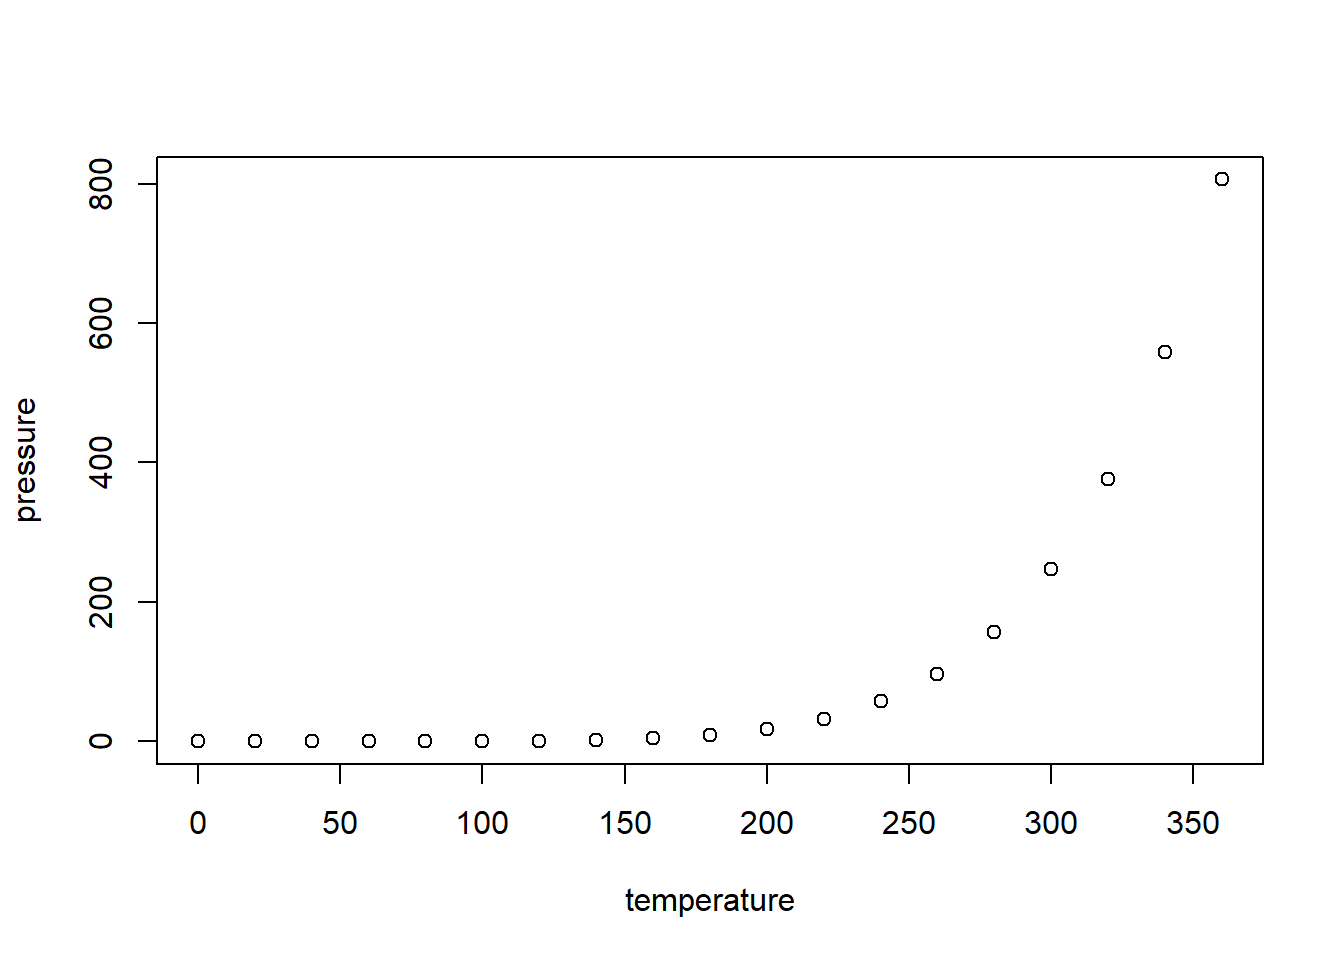
plot(pressure)
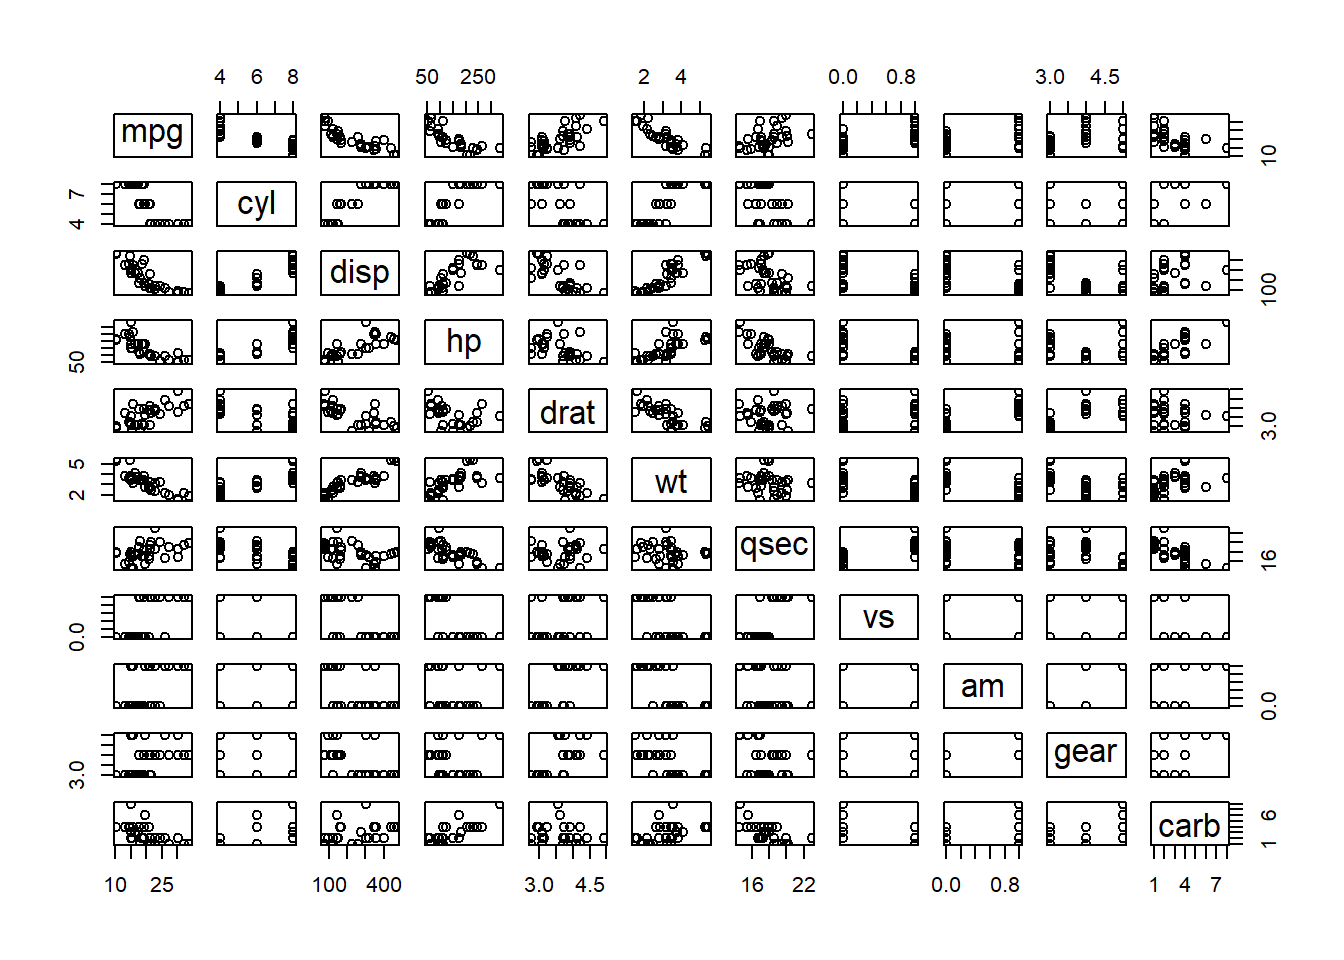
plot(mtcars)
```
::: {.cell-output-display}
{#fig-panel-1 width=672}
:::
::: {.cell-output-display}
{#fig-panel-2 width=672}
:::
::: {.cell-output-display}
{#fig-panel-3 width=672}
:::
Panel
:::plot(cars)
plot(pressure)
plot(mtcars)


Use layout
```{r, layout=list(c(45,-10, 45), c(100))}
plot(cars)
plot(pressure)
plot(mtcars)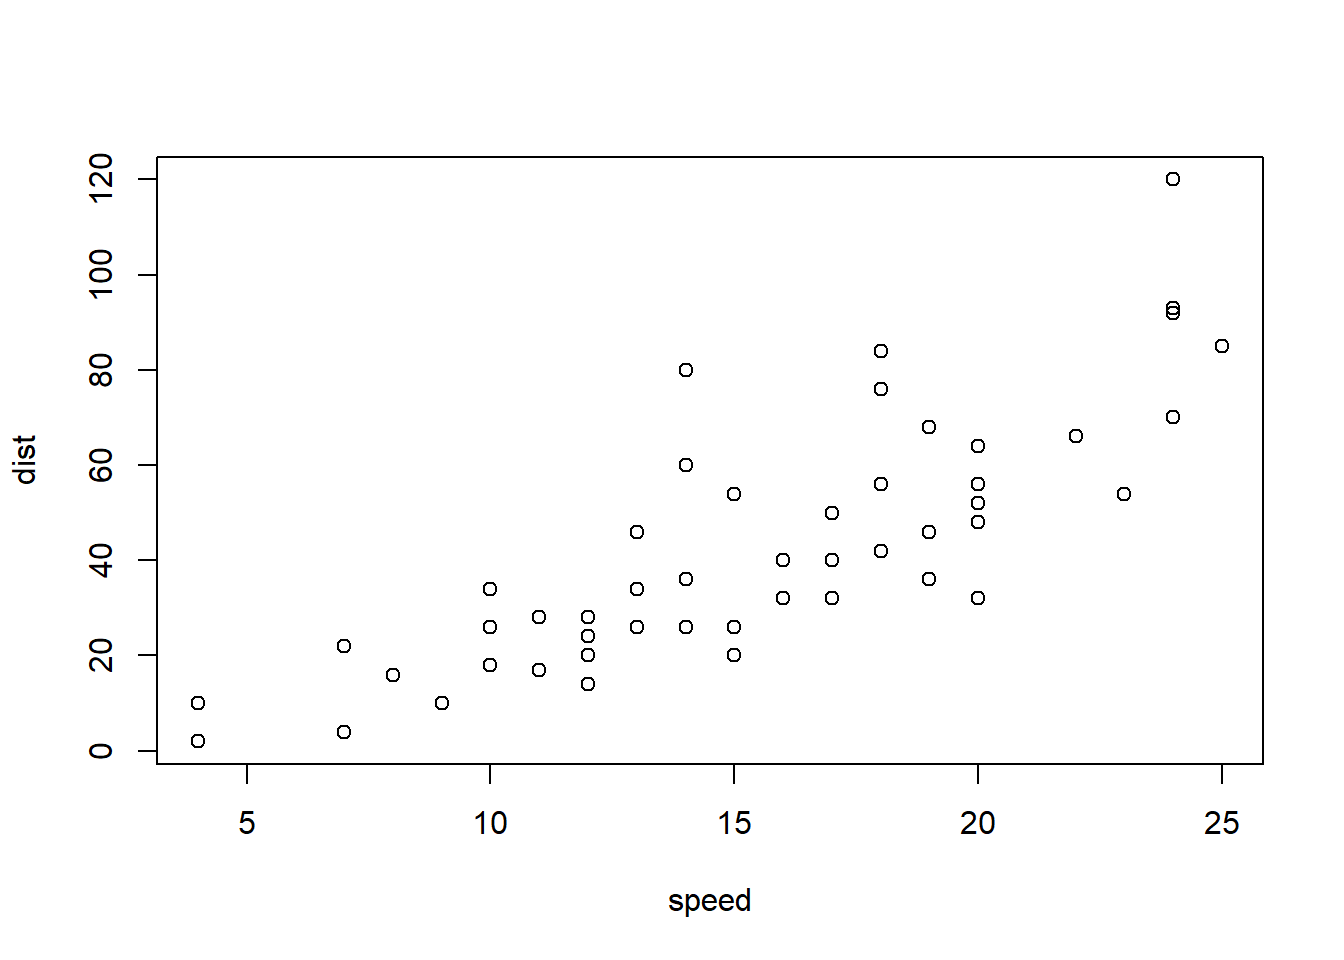


Layout tables
```{r, layout-ncol=2}
library(knitr)
kable(head(cars), caption = "Cars")
kable(head(pressure), caption = "Pressure")| speed | dist |
|---|---|
| 4 | 2 |
| 4 | 10 |
| 7 | 4 |
| 7 | 22 |
| 8 | 16 |
| 9 | 10 |
| temperature | pressure |
|---|---|
| 0 | 0.0002 |
| 20 | 0.0012 |
| 40 | 0.0060 |
| 60 | 0.0300 |
| 80 | 0.0900 |
| 100 | 0.2700 |