Jupyter Crossrefs

Author

JJ Allaire

Published

Invalid Date

TipLearn more

See the full guide on Cross References.

Figures

```{python}
#| label: fig-scores
#| fig-cap: "Scores"
#| code-fold: true
Code
import matplotlib.pyplot as plt

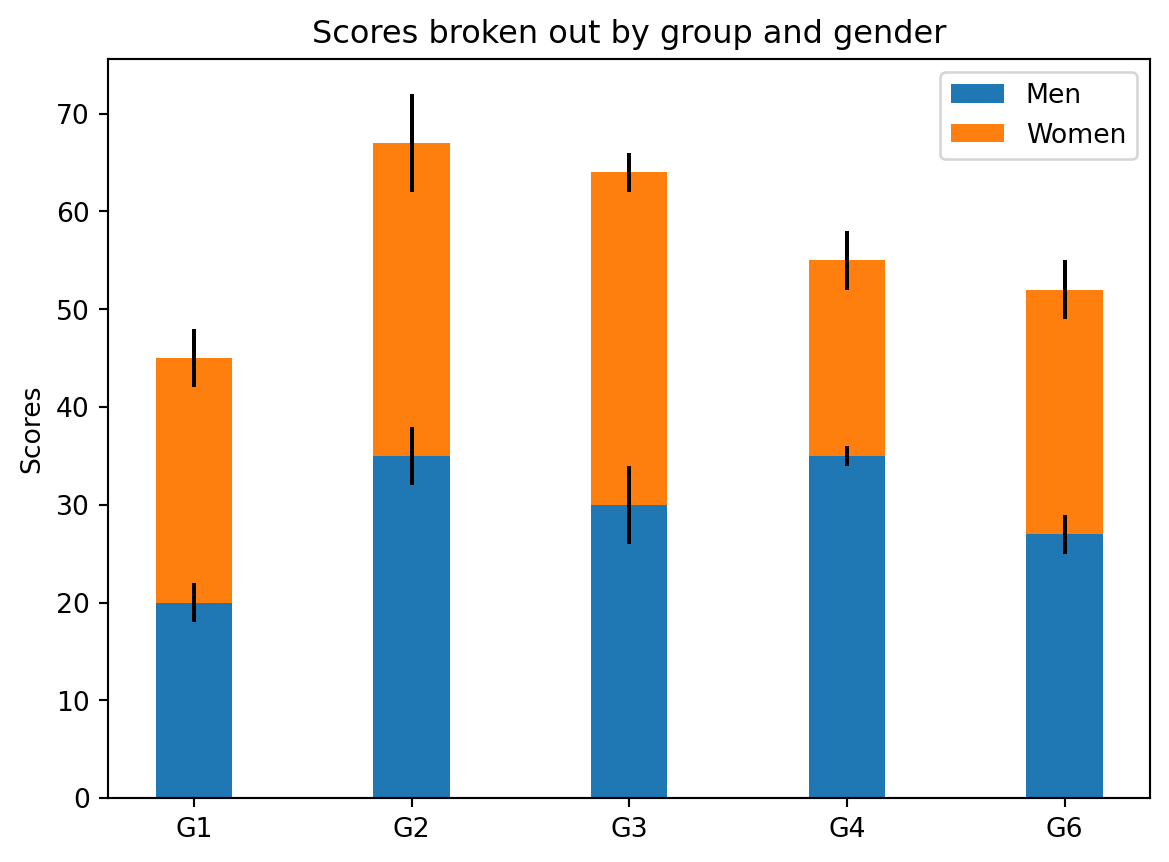
labels = ['G1', 'G2', 'G3', 'G4', 'G6']
men_means = [20, 35, 30, 35, 27]
women_means = [25, 32, 34, 20, 25]
men_std = [2, 3, 4, 1, 2]
women_std = [3, 5, 2, 3, 3]
width = 0.35       # the width of the bars: can also be len(x) sequence

fig, ax = plt.subplots()

ax.bar(labels, men_means, width, yerr=men_std, label='Men')
ax.bar(labels, women_means, width, yerr=women_std, bottom=men_means,
      label='Women')

ax.set_ylabel('Scores')
ax.set_title('Scores broken out by group and gender')
ax.legend()
plt.show()
Figure 1: Scores

See Figure 1.

Sub-Figures

```{python}
#| label: fig-multiple
#| fig-cap: "Multiple"
#| fig-subcap: ["First", "Second"]
#| layout-ncol: 2
#| code-fold: true
Code
import matplotlib.pyplot as plt

labels = ['G1', 'G2', 'G3', 'G4', 'G5']
men_means = [20, 35, 30, 35, 27]
women_means = [25, 32, 34, 20, 25]
men_std = [2, 3, 4, 1, 2]
women_std = [3, 5, 2, 3, 3]
width = 0.35       # the width of the bars: can also be len(x) sequence

# first figure
fig, ax = plt.subplots()
ax.bar(labels, men_means, width, yerr=men_std, label='Men')
ax.bar(labels, women_means, width, yerr=women_std, bottom=men_means,
       label='Women')

ax.set_ylabel('Scores')
ax.set_title('Scores broken out by group and gender')
ax.legend()
plt.show()

# second figure
fig, ax = plt.subplots()
ax.bar(labels, men_means, width, yerr=men_std, label='Men')
ax.bar(labels, women_means, width, yerr=women_std, bottom=men_means,
       label='Women')

ax.set_ylabel('Scores')
ax.set_title('Scores broken out by group and gender')
ax.legend()
plt.show()
(a) First
(b) Second
Figure 2: Multiple

See Figure 2 (a) and Figure 2 (b).

Tables

import pandas as pd
from tabulate import tabulate
from IPython.display import Markdown, display

d = {'one' : [1., 2., 3., 4.],
     'two' : [4., 3., 2., 1.]}
df = pd.DataFrame(d)
display(Markdown(tabulate(df, headers=["One", "Two"], tablefmt="github") + 
        "\n\nTable: Here is the Caption {#tbl-mytable}"))
Table 1: Here is the Caption
One Two
0 1 4
1 2 3
2 3 2
3 4 1

See Table 1 for additional details on this notebook.